Project Overview
This comprehensive exploratory data analysis project examines customer spending patterns and behavior across multiple dimensions in an e-commerce dataset. The analysis reveals critical insights into customer demographics, geographic spending variations, and satisfaction correlations that drive business decision-making.
Through statistical analysis and data visualization, this project uncovers actionable patterns that can inform marketing strategies, customer segmentation, and revenue optimization efforts.
Key Features
- Data Quality Checks: Detected and handled missing values, duplicates, and inconsistencies across categorical labels.
- Multi-dimensional Analysis: Comprehensive examination of spending patterns across gender, geography, and satisfaction levels.
- Statistical Distribution Analysis: Detailed exploration of spending distribution patterns with density curve overlays.
- Geographic Market Intelligence: City-wise spending analysis revealing high-value markets and expansion opportunities.
- Customer Segmentation Insights: Gender-based spending behavior analysis with statistical significance testing.
- Satisfaction-Revenue Correlation: Investigation of the relationship between customer satisfaction and spending behavior.
- Interactive Visualizations: Executive-ready dashboard with key performance indicators and actionable metrics.
Technologies Used
- Language: Python
- Libraries: pandas, matplotlib, seaborn
- Environment: Jupyter Notebook
- Data Format: CSV (tabular customer data)
- Power BI: Dashboard creation and business intelligence
Screenshots
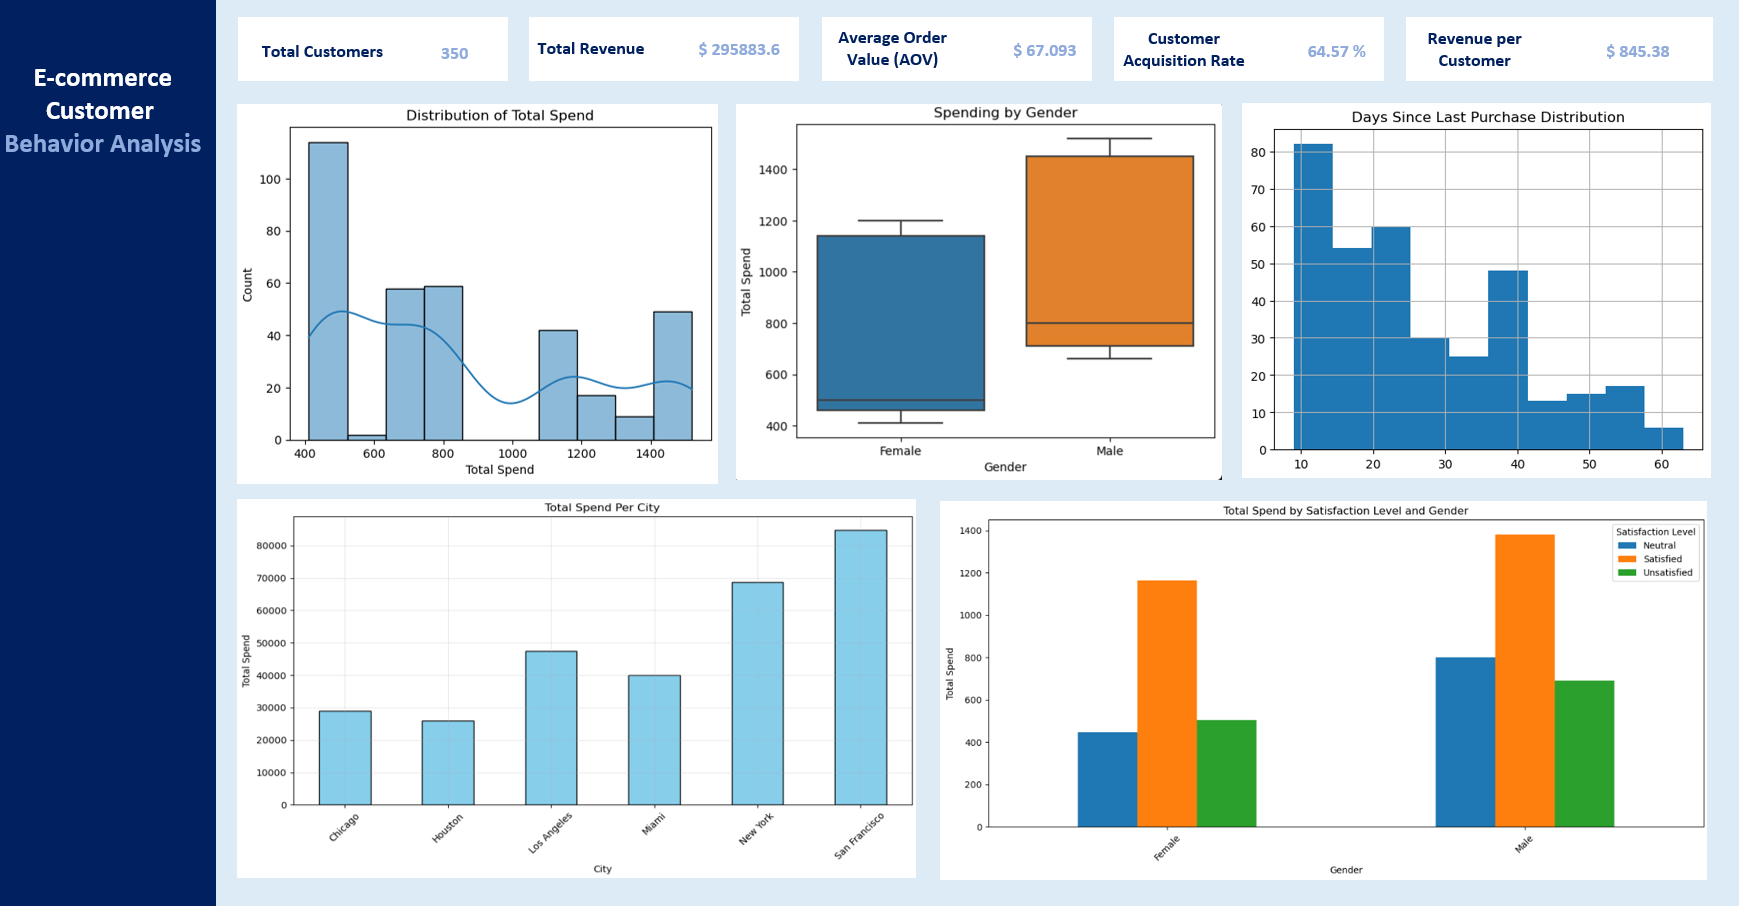
This histogram shows a right-skewed spending distribution with most customers spending $400-600, while a smaller segment represents high-value customers at $1,200-1,500. The multimodal pattern suggests distinct customer segments that could inform targeted marketing strategies.
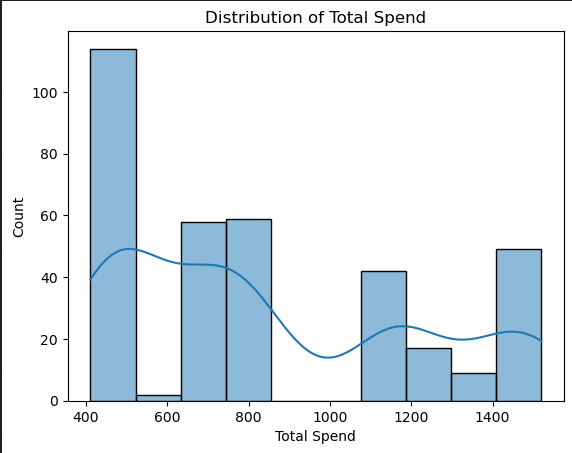
San Francisco leads with $85,000 total spend, followed by New York at $69,000, while Houston shows the lowest at $26,000. This geographic variation reveals premium markets and potential expansion opportunities.
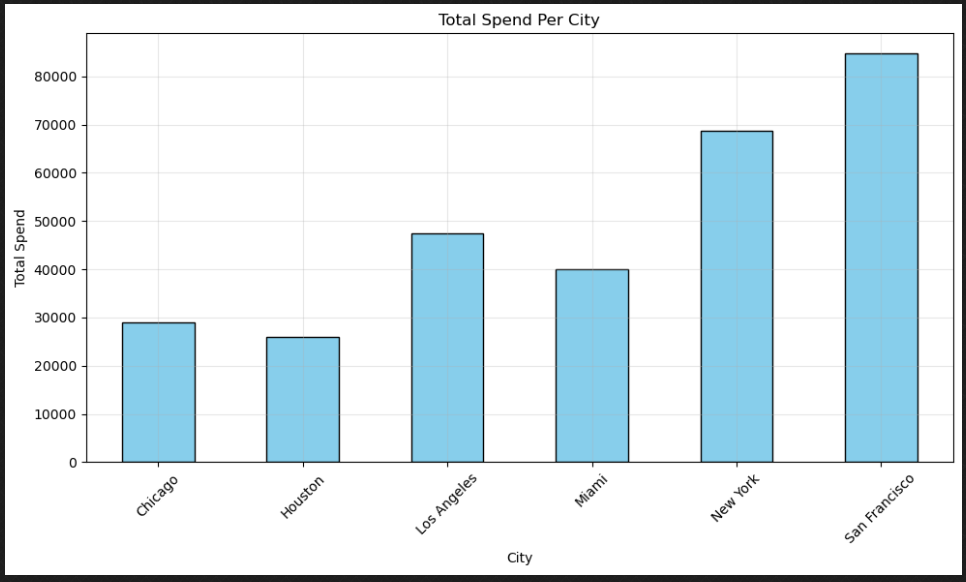
Males demonstrate significantly higher spending with a median around $800 compared to females at $500. The larger interquartile range for males also indicates greater spending variability.
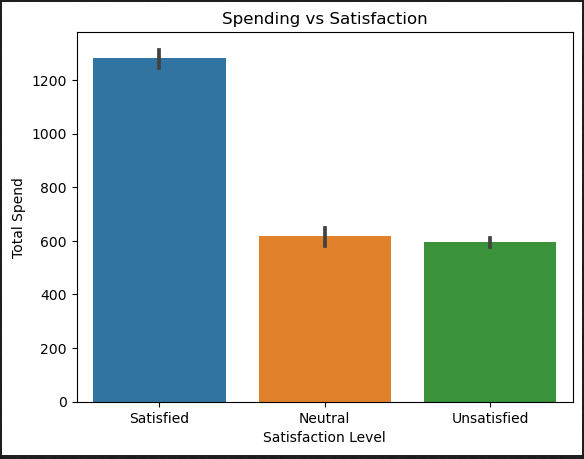
Satisfied customers show the highest average spending at $1,300, significantly outperforming neutral ($620) and unsatisfied ($600) customers. This suggests successful premium service delivery leads to both higher spending and satisfaction.
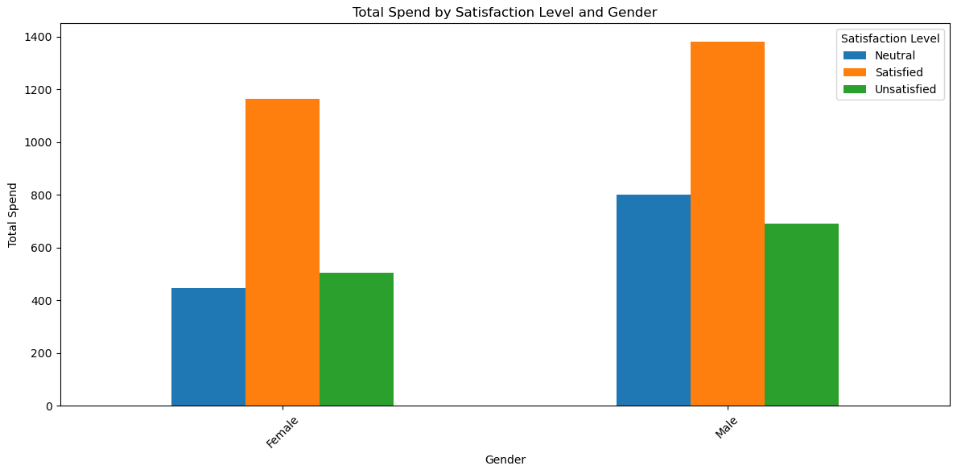
This segmented view reveals satisfied customers spend most across both genders, with satisfied males reaching $1,400 and satisfied females at $1,200. The analysis confirms gender as a strong predictor of spending behavior across all satisfaction levels.
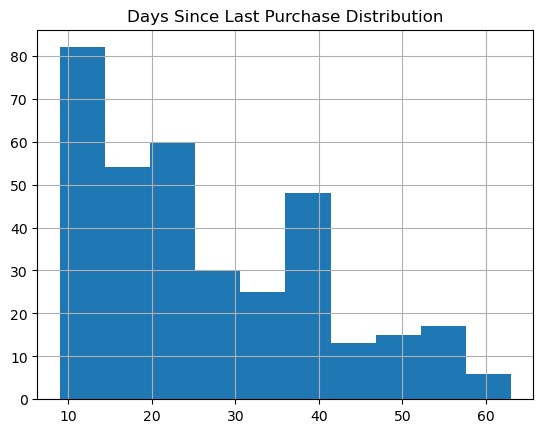
The distribution shows most customers (80+ count) made recent purchases within 10 days, with a steep decline afterward and a smaller peak around 40 days. This pattern suggests strong customer engagement with a subset of less frequent buyers, indicating opportunities for re-engagement campaigns targeting the 40+ day segment.
Outcome & Impact
This analysis provides actionable insights that directly impact business strategy and revenue growth. The interactive Power BI dashboard enables stakeholders to explore data dynamically, while the identification of high-spending customer segments and geographic markets facilitates targeted marketing campaigns.
The satisfaction-spending correlation reveals opportunities for customer experience improvements, and the comprehensive KPI tracking supports data-driven decisions for inventory management, pricing strategies, and market expansion.
The project demonstrates end-to-end analytics capabilities, from Python-based statistical analysis to executive-ready business intelligence dashboards, ultimately contributing to enhanced customer lifetime value and business profitability.