Project Overview
Developed a comprehensive Power BI dashboard solution for retail sales analysis using Superstore data, transforming raw transactional data into actionable business insights. This project demonstrates end-to-end business intelligence capabilities, from data modeling to interactive visualization design.
The dashboard serves as a strategic tool for retail decision-makers, enabling them to monitor sales performance, identify growth opportunities, and optimize product portfolios across different regions and customer segments.
Key Features
- Dimensional Data Model: Designed and implemented a star schema with DimCustomer, DimProduct, DimGeographique, and DimDate tables connected to a central fact table through one-to-many relationships
- Data Quality Solutions: Resolved data integrity challenges by implementing surrogate keys to address non-unique ProductID, CustomerID, and Zipcode issues
- Normalized Structure: Created a scalable data model optimized for performance and analytical flexibility
- Dynamic Filtering System: Implemented advanced slicers enabling real-time filtering by region, product category, and customer segments.
- Drill-Through Analytics: Built dedicated drill-through pages for granular regional sales analysis and performance deep-dives.
- Visual Analytics: Incorporated trend lines and heatmaps to identify seasonal patterns, sales peaks, and underperforming product categories.
- KPI Monitoring: Developed executive-level KPI cards displaying critical metrics at a glance.
- Custom DAX Measures: Engineered sophisticated DAX formulas for calculating Total Sales, Profit Margins, and Sales Growth Rate.
- Performance Metrics: Created comparative analysis capabilities for period-over-period performance tracking.
- Profitability Analysis: Built comprehensive profit margin calculations across different business dimensions.
Data Architecture & Modeling
Interactive Dashboard Components
Advanced Analytics & Calculations
Technologies Used
- Power BI Desktop: Primary platform for data modeling, visualization design, and dashboard development
- DAX (Data Analysis Expressions): Advanced formula language for creating calculated columns, measures, and KPIs
- Power Query: Data transformation and cleansing engine for preprocessing raw datasets
- Data Modeling: Implemented star schema architecture with surrogate keys and relationship management
- Business Intelligence: Applied BI best practices for performance optimization and user experience design
Screenshots
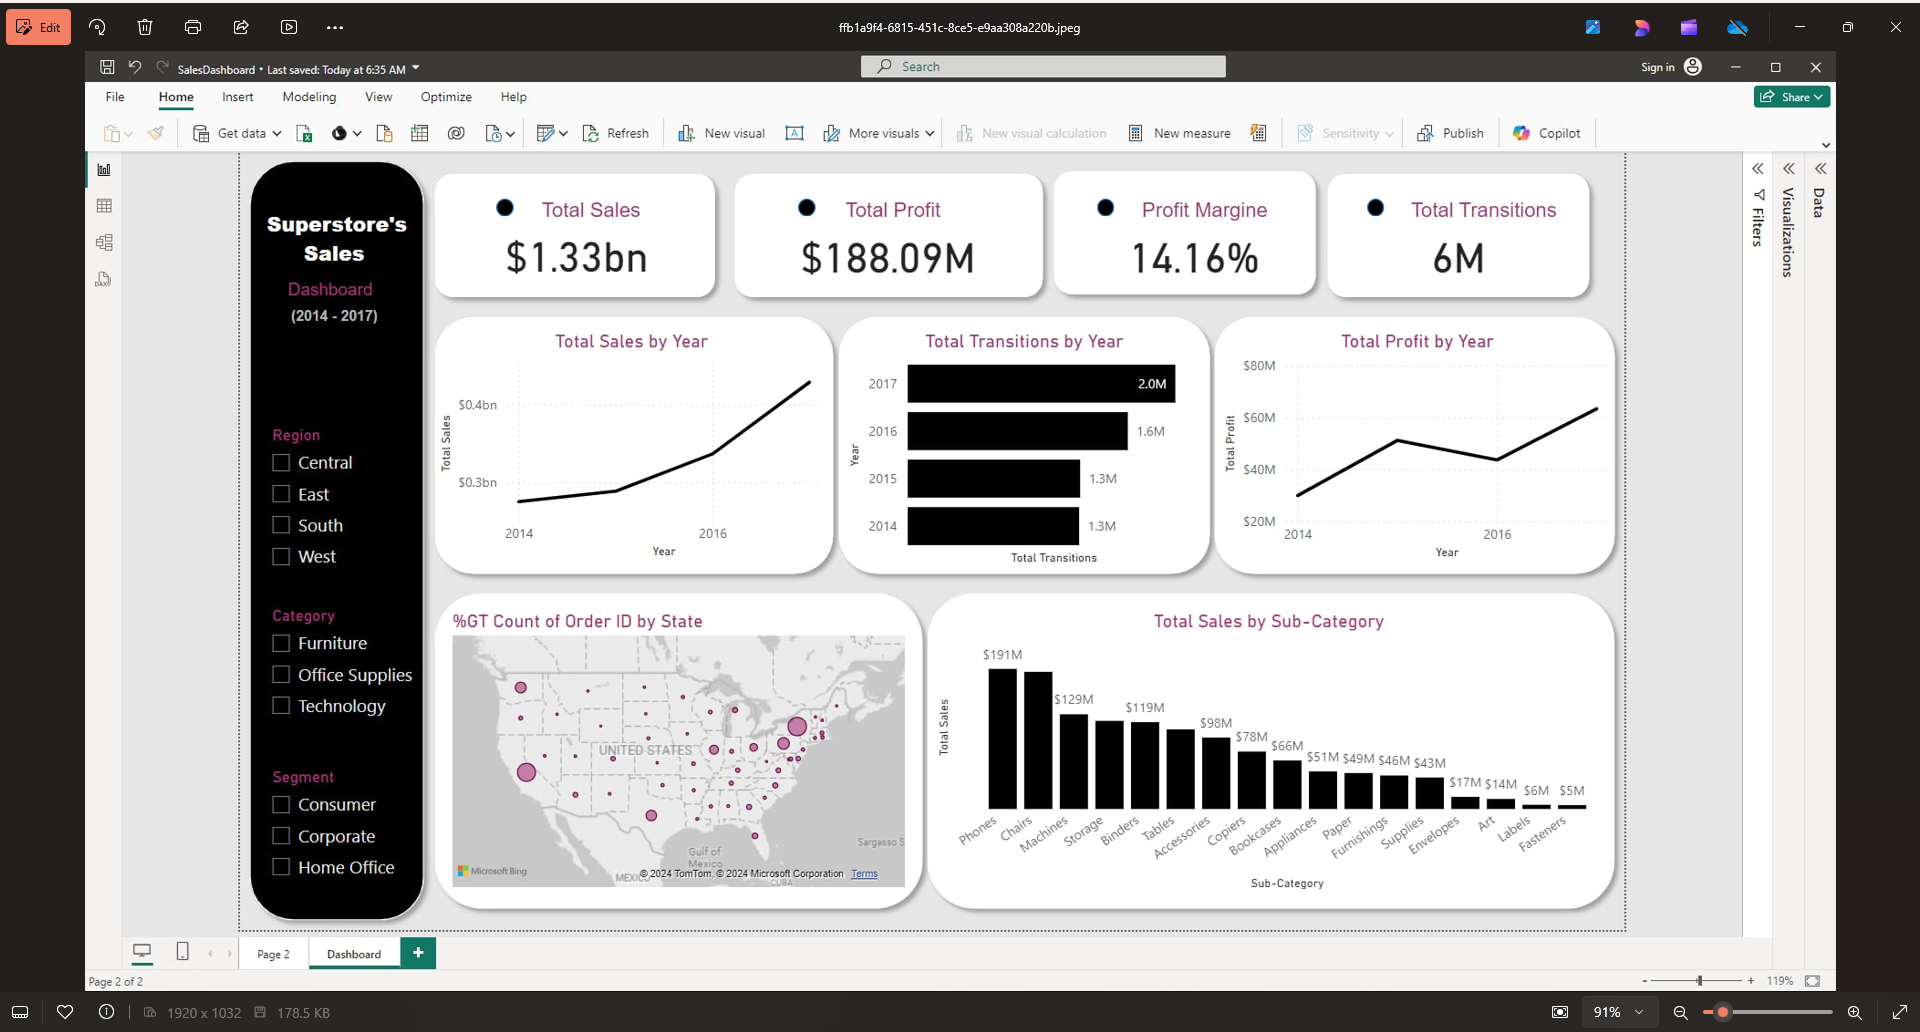
Interactive Dashboard: Shows the main sales dashboard with KPI cards ($1.33bn sales, $188M profit), trend charts, geographic map, and product category analysis with dynamic filters for region, category, and customer segments.
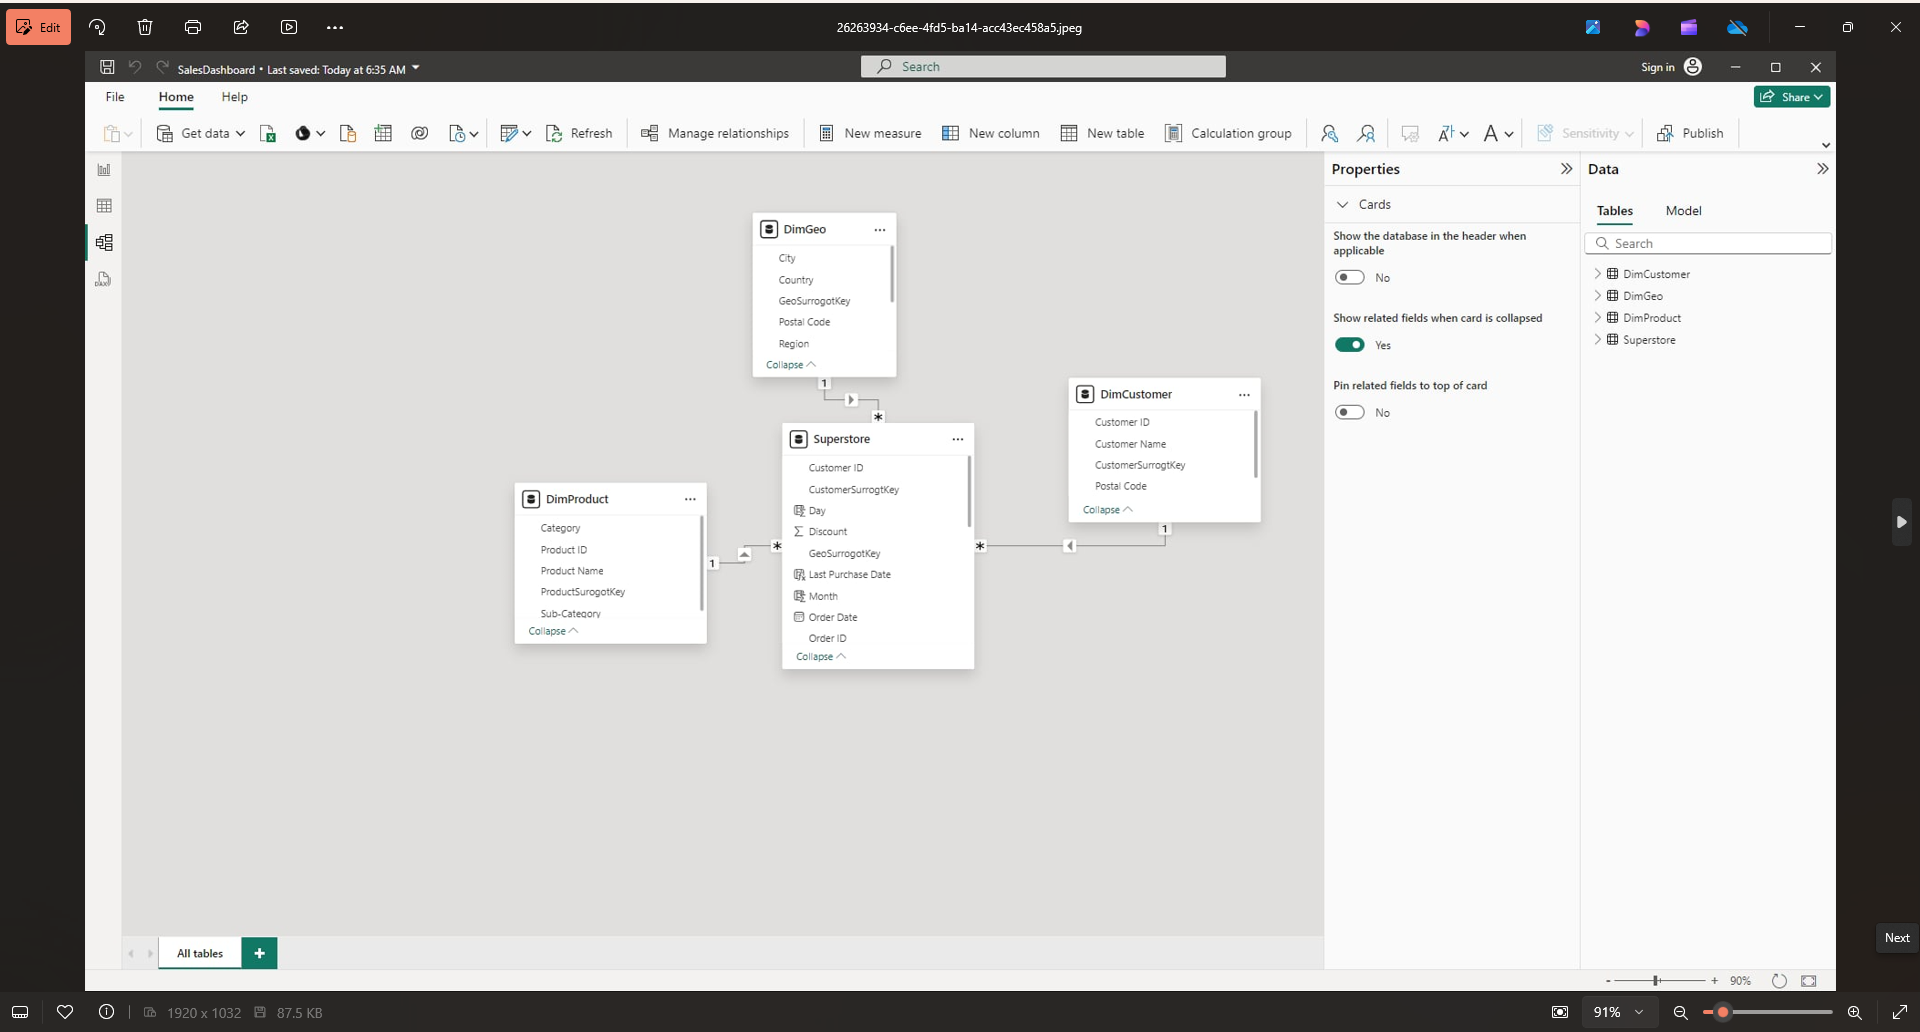
Data Model: Displays the star schema architecture with dimension tables (DimGeo, DimCustomer, DimProduct) connected to the central Superstore fact table through one-to-many relationships.
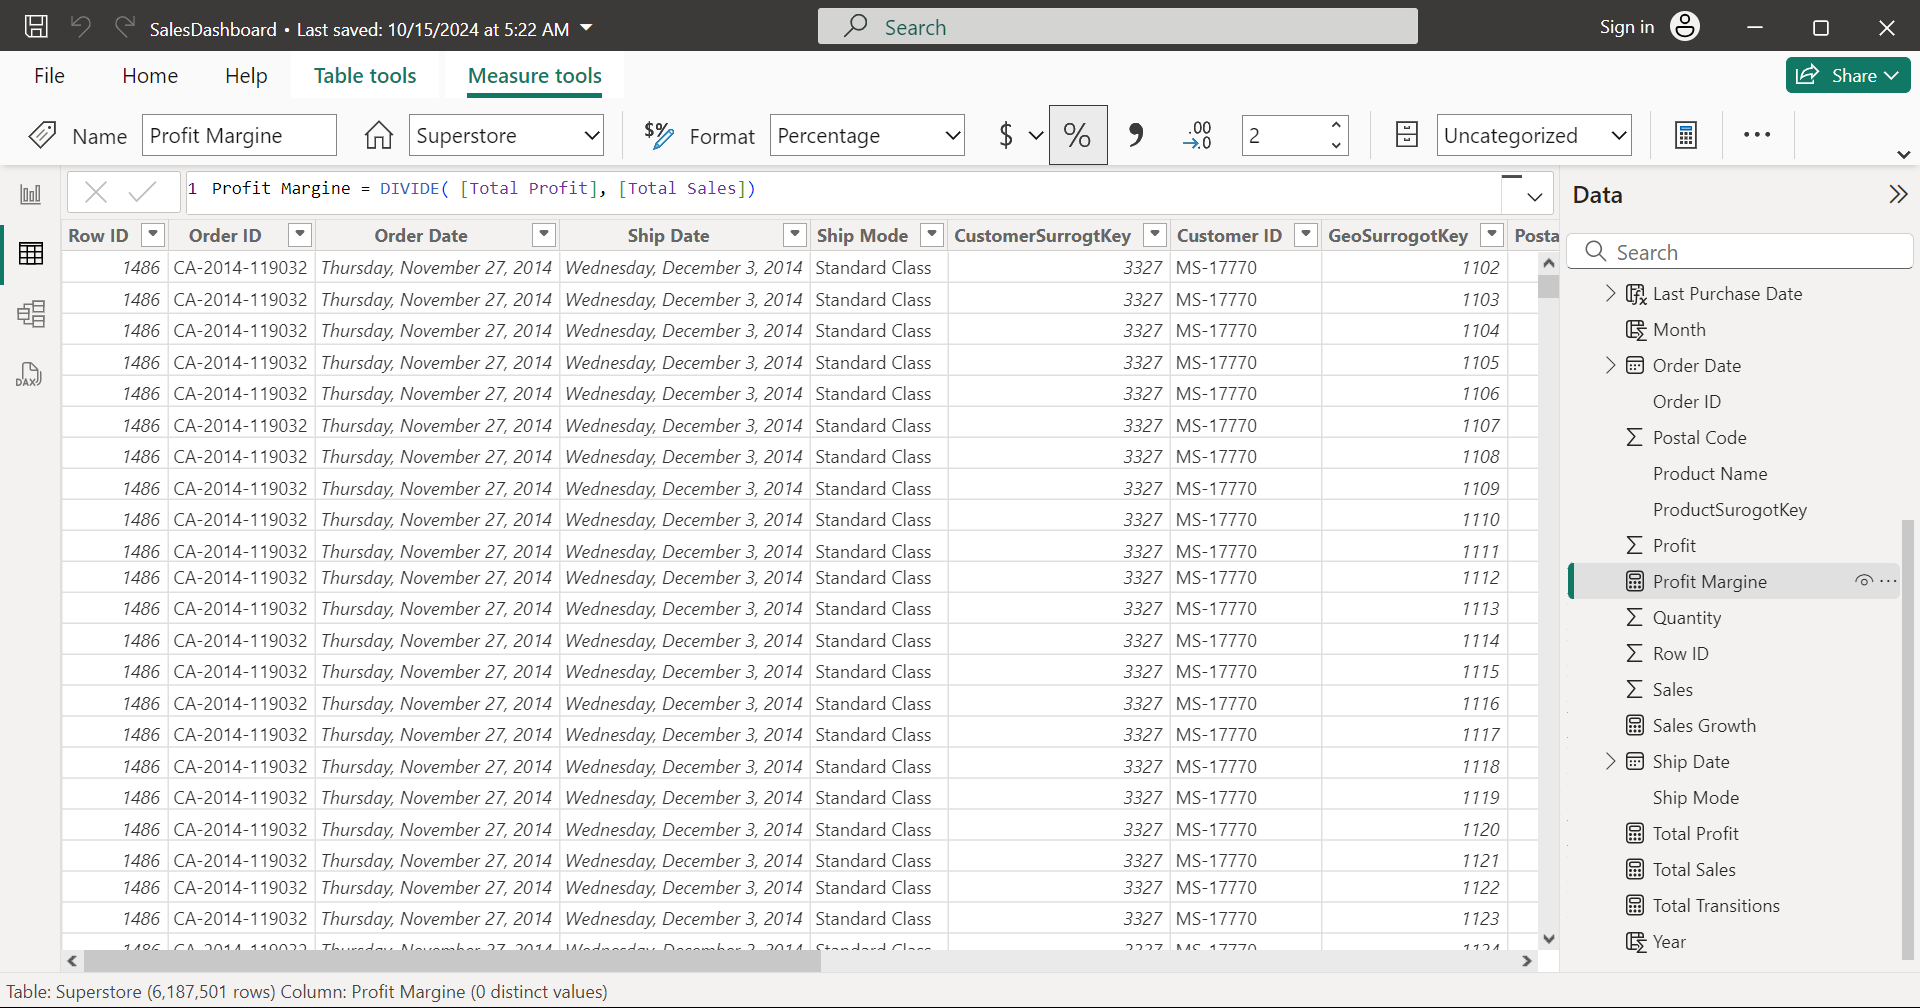
DAX Development: Shows creation of a custom "Profit Margin" measure using DAX formula DIVIDE([Total Profit], [Total Sales]) along with other calculated metrics like Sales Growth and Total Sales.
Outcome & Impact
- Enhanced Decision Making: Transformed complex sales data into intuitive visualizations for quick trend identification.
- Operational Efficiency: Automated reporting processes and enabled self-service analytics capabilities.
- Strategic Insights: Identified high-performing regions and product categories to support strategic planning
- Built a scalable data model with efficient DAX calculations and optimized performance.
- Created an intuitive dashboard interface enabling independent data exploration.
- Consolidated multiple data sources into a single source of truth.
- Enabled real-time monitoring across 3 geographic regions and 17 product categories.
- Provided drill-down capabilities from high-level KPIs to transaction-level details.
- Facilitated data-driven decision making for product portfolio optimization.